Note
Click here to download the full example code
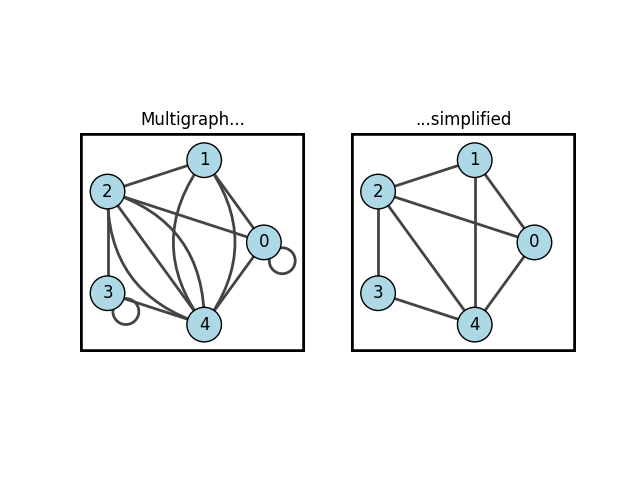
Simplify
This example shows how to remove self loops and multiple edges using igraph.GraphBase.simplify().
import igraph as ig
import matplotlib.pyplot as plt
We start with a graph that includes loops and multiedges:
g1 = ig.Graph([
    (0, 1),
    (1, 2),
    (2, 3),
    (3, 4),
    (4, 0),
    (0, 0),
    (1, 4),
    (1, 4),
    (0, 2),
    (2, 4),
    (2, 4),
    (2, 4),
    (3, 3)],
)
To simplify the graph, we must remember that the function operates in place, i.e. directly changes the graph that it is run on. So we need to first make a copy of our graph, and then simplify that copy to keep the original graph untouched:
g2 = g1.copy()
g2.simplify()
<igraph.Graph object at 0x7f7b636a0140>
We can then proceed to plot both graphs to see the difference. First, let’s choose a consistent visual style:
visual_style = {
    "vertex_color": "lightblue",
    "vertex_size": 0.4,
    "vertex_label": [0, 1, 2, 3, 4],
}
And finally, let’s plot them in twin axes, with rectangular frames around each plot:
fig, axs = plt.subplots(1, 2, sharex=True, sharey=True)
ig.plot(
    g1,
    layout="circle",
    target=axs[0],
    **visual_style,
)
ig.plot(
    g2,
    layout="circle",
    target=axs[1],
    **visual_style,
)
axs[0].set_title('Multigraph...')
axs[1].set_title('...simplified')
# Draw rectangles around axes
axs[0].add_patch(plt.Rectangle(
    (0, 0), 1, 1, fc='none', ec='k', lw=4, transform=axs[0].transAxes,
    ))
axs[1].add_patch(plt.Rectangle(
    (0, 0), 1, 1, fc='none', ec='k', lw=4, transform=axs[1].transAxes,
    ))
plt.show()
Total running time of the script: ( 0 minutes 0.129 seconds)