Note
Click here to download the full example code
Configuration Instance
This example shows how to use igraph’s configuration instance to set default igraph settings. This is useful for setting global settings so that they don’t need to be explicitly stated at the beginning of every igraph project you work on.
import igraph as ig
import matplotlib.pyplot as plt
import random
First we define the default plotting backend, layout, and color palette.
ig.config["plotting.backend"] = "matplotlib"
ig.config["plotting.layout"] = "fruchterman_reingold"
ig.config["plotting.palette"] = "rainbow"
Then, we save them. By default, ig.config.save() will save files to
~/.igraphrc on Linux and Max OS X systems, or in
%USERPROFILE%\.igraphrc for Windows systems:
ig.config.save()
The code above only needs to be run once (to store the new config options
into the .igraphrc file). Whenever you use igraph and this file exists,
igraph will read its content and use those options as defaults. For
example, let’s create and plot a new graph to demonstrate:
random.seed(1)
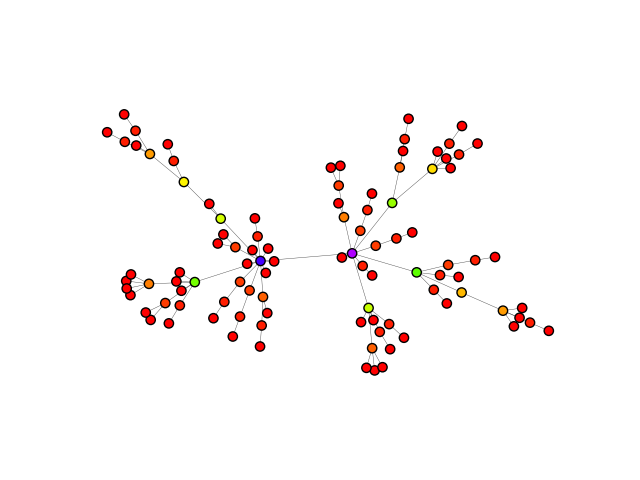
g = ig.Graph.Barabasi(n=100, m=1)
We now calculate a color value between 0-200 for all nodes, for instance by computing the vertex betweenness:
betweenness = g.betweenness()
colors = [int(i * 200 / max(betweenness)) for i in betweenness]
Finally, we can plot the graph. You will notice that even though we did not create a dedicated figure and axes, matplotlib is now used by default:
ig.plot(g, vertex_color=colors, vertex_size=1, edge_width=0.3)
plt.show()
The full list of config settings can be found at
igraph.Configuration.
Note
You can have multiple config files: specify each location via
ig.config.save("./path/to/config/file"). To load a specific config,
import igraph and then call ig.config.load("./path/to/config/file")
Note
To use a consistent style between individual plots (e.g. vertex sizes, colors, layout etc.) check out Visual styling.
Total running time of the script: ( 0 minutes 0.451 seconds)