Note
Click here to download the full example code
Maximum Flow
This example shows how to construct a max flow on a directed graph with edge capacities using igraph.Graph.maxflow().
import igraph as ig
import matplotlib.pyplot as plt
First, we generate a graph and assign a “capacity” to each edge:
g = ig.Graph(
    6,
    [(3, 2), (3, 4), (2, 1), (4,1), (4, 5), (1, 0), (5, 0)],
    directed=True
)
g.es["capacity"] = [7, 8, 1, 2, 3, 4, 5]
To find the max flow, we can simply run:
flow = g.maxflow(3, 0, capacity=g.es["capacity"])

print("Max flow:", flow.value)
print("Edge assignments:", flow.flow)

# Output:
# Max flow: 6.0
# Edge assignments [1.0, 5.0, 1.0, 2.0, 3.0, 3.0, 3.0]
Max flow: 6.0
Edge assignments: [1.0, 5.0, 1.0, 2.0, 3.0, 3.0, 3.0]
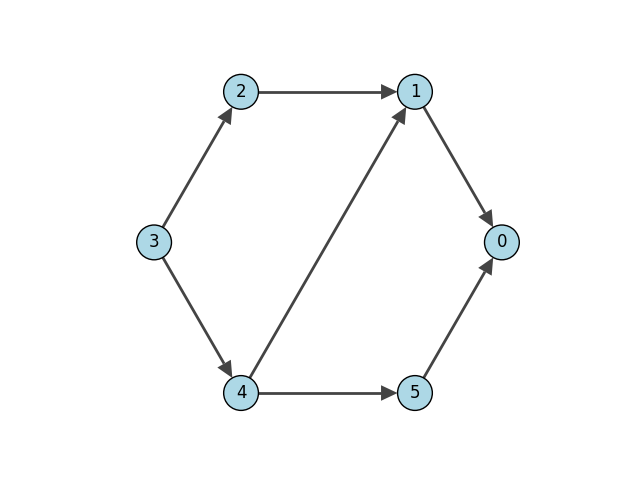
Finally, we can plot the directed graph to look at the situation:
fig, ax = plt.subplots()
ig.plot(
    g,
    target=ax,
    layout="circle",
    vertex_label=range(g.vcount()),
    vertex_color="lightblue"
)
plt.show()
Total running time of the script: ( 0 minutes 0.075 seconds)