Note
Click here to download the full example code
Quick Start
For the eager folks out there, this intro will give you a quick overview of the following operations:
Construct a graph
Set attributes of nodes and edges
Plot a graph using matplotlib
Save the plot as an image
Export and import a graph as a
.gmlfile
To find out more features that igraph has to offer, check out the Examples!
/home/docs/checkouts/readthedocs.org/user_builds/igraph/envs/0.10.2/lib/python3.9/site-packages/igraph/__init__.py:1498: RuntimeWarning: The boolean edge attribute 'married' was converted to numeric. at src/io/gml.c:1281
  return writer(f, *args, **kwds)
import igraph as ig
import matplotlib.pyplot as plt
# Construct a graph with 3 vertices
n_vertices = 3
edges = [(0, 1), (0, 2), (0, 3), (0, 4), (1, 2), (1, 3), (1, 4), (3, 4)]
g = ig.Graph(n_vertices, edges)
# Set attributes for the graph, nodes, and edges
g["title"] = "Small Social Network"
g.vs["name"] = ["Daniel Morillas", "Kathy Archer", "Kyle Ding", "Joshua Walton", "Jana Hoyer"]
g.vs["gender"] = ["M", "F", "F", "M", "F"]
g.es["married"] = [False, False, False, False, False, False, False, True]
# Set individual attributes
g.vs[1]["name"] = "Kathy Morillas"
g.es[0]["married"] = True
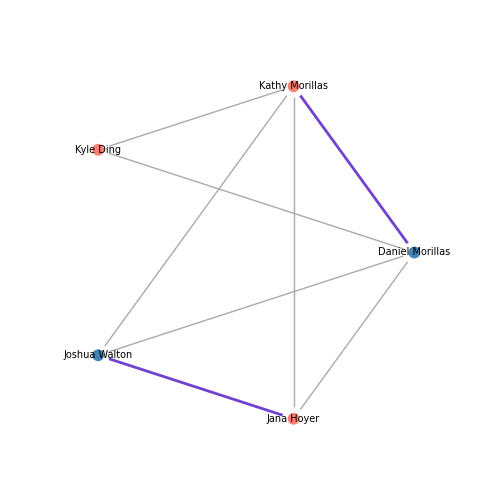
# Plot in matplotlib
# Note that attributes can be set globally (e.g. vertex_size), or set individually using arrays (e.g. vertex_color)
fig, ax = plt.subplots(figsize=(5,5))
ig.plot(
g,
target=ax,
layout="circle", # print nodes in a circular layout
vertex_size=0.1,
vertex_color=["steelblue" if gender == "M" else "salmon" for gender in g.vs["gender"]],
vertex_frame_width=4.0,
vertex_frame_color="white",
vertex_label=g.vs["name"],
vertex_label_size=7.0,
edge_width=[2 if married else 1 for married in g.es["married"]],
edge_color=["#7142cf" if married else "#AAA" for married in g.es["married"]]
)
plt.show()
# Save the graph as an image file
fig.savefig('social_network.png')
fig.savefig('social_network.jpg')
fig.savefig('social_network.pdf')
# Export and import a graph as a GML file.
g.save("social_network.gml")
g = ig.load("social_network.gml")
Total running time of the script: ( 0 minutes 0.223 seconds)