Note
Click here to download the full example code
Minimum Spanning Trees
This example shows how to generate a minimum spanning tree from an input graph using igraph.Graph.spanning_tree(). If you only need a regular spanning tree, check out Spanning Trees.
import random
import igraph as ig
import matplotlib.pyplot as plt
We start by generating a grid graph with random integer weights between 1 and 20:
random.seed(0)
g = ig.Graph.Lattice([5, 5], circular=False)
g.es["weight"] = [random.randint(1, 20) for _ in g.es]
We can then compute a minimum spanning tree using
igraph.Graph.spanning_tree(), making sure to pass in the randomly
generated weights.
mst_edges = g.spanning_tree(weights=g.es["weight"], return_tree=False)
We can print out the minimum edge weight sum
print("Minimum edge weight sum:", sum(g.es[mst_edges]["weight"]))

# Minimum edge weight sum: 136
Minimum edge weight sum: 201
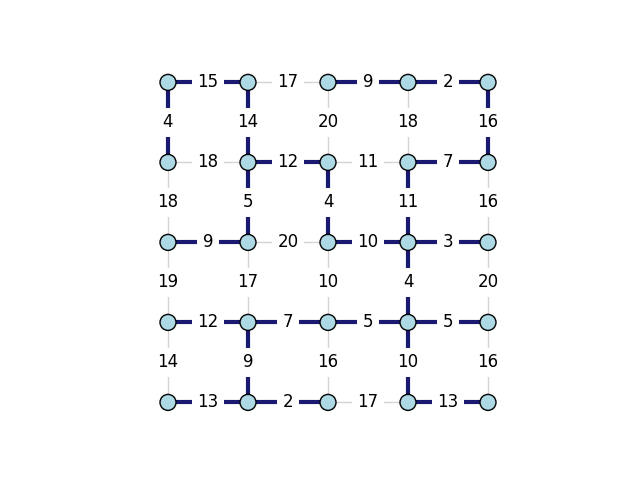
Finally, we can plot the graph, highlighting the edges that are part of the minimum spanning tree.
g.es["color"] = "lightgray"
g.es[mst_edges]["color"] = "midnightblue"
g.es["width"] = 1.0
g.es[mst_edges]["width"] = 3.0

fig, ax = plt.subplots()
ig.plot(
    g,
    target=ax,
    layout="grid",
    vertex_color="lightblue",
    edge_width=g.es["width"],
    edge_label=g.es["weight"],
    edge_background="white",
)
plt.show()
Total running time of the script: ( 0 minutes 0.186 seconds)