Note
Click here to download the full example code
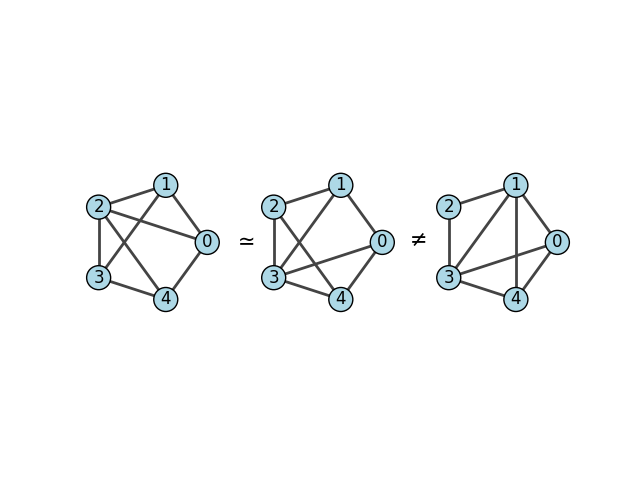
Isomorphism
This example shows how to check for isomorphism between small graphs using igraph.GraphBase.isomorphic().
import igraph as ig
import matplotlib.pyplot as plt
First we generate three different graphs:
g1 = ig.Graph([(0, 1), (0, 2), (0, 4), (1, 2), (1, 3), (2, 3), (2, 4), (3, 4)])
g2 = ig.Graph([(4, 2), (4, 3), (4, 0), (2, 3), (2, 1), (3, 1), (3, 0), (1, 0)])
g3 = ig.Graph([(4, 1), (4, 3), (4, 0), (2, 3), (2, 1), (3, 1), (3, 0), (1, 0)])
To check whether they are isomorphic, we can use a simple method:
print("Are the graphs g1 and g2 isomorphic?")
print(g1.isomorphic(g2))
print("Are the graphs g1 and g3 isomorphic?")
print(g1.isomorphic(g3))
print("Are the graphs g2 and g3 isomorphic?")
print(g2.isomorphic(g3))

# Output:
# Are the graphs g1 and g2 isomorphic?
# True
# Are the graphs g1 and g3 isomorphic?
# False
# Are the graphs g2 and g3 isomorphic?
# False
Are the graphs g1 and g2 isomorphic?
True
Are the graphs g1 and g3 isomorphic?
False
Are the graphs g2 and g3 isomorphic?
False
Note
Graph isomorphism is an equivalence relationship, i.e. if g1 ~ g2 and g2 ~ g3, then automatically g1 ~ g3. Therefore, we could have skipped the last check.
We can plot the graphs to get an idea about the problem:
visual_style = {
    "vertex_color": "lightblue",
    "vertex_label": [0, 1, 2, 3, 4],
    "vertex_size": 0.4,
}

fig, axs = plt.subplots(1, 3)
ig.plot(
    g1,
    layout=g1.layout("circle"),
    target=axs[0],
    **visual_style,
)
ig.plot(
    g2,
    layout=g1.layout("circle"),
    target=axs[1],
    **visual_style,
)
ig.plot(
    g3,
    layout=g1.layout("circle"),
    target=axs[2],
    **visual_style,
)
fig.text(0.38, 0.5, '$\simeq$' if g1.isomorphic(g2) else '$\\neq$', fontsize=15, ha='center', va='center')
fig.text(0.65, 0.5, '$\simeq$' if g2.isomorphic(g3) else '$\\neq$', fontsize=15, ha='center', va='center')
plt.show()
Total running time of the script: ( 0 minutes 0.362 seconds)