Note
Click here to download the full example code
Bridges
This example shows how to compute and visualize the bridges in a graph using igraph.GraphBase.bridges(). For an example on articulation points instead, see Articulation Points.
import igraph as ig
import matplotlib.pyplot as plt
Let’s start with a simple example. We begin by constructing a graph that includes a few bridges:
g = ig.Graph(14, [(0, 1), (1, 2), (2, 3), (0, 3), (0, 2), (1, 3), (3, 4),
        (4, 5), (5, 6), (6, 4), (6, 7), (7, 8), (7, 9), (9, 10), (10 ,11),
        (11 ,7), (7, 10), (8, 9), (8, 10), (5, 12), (12, 13)])
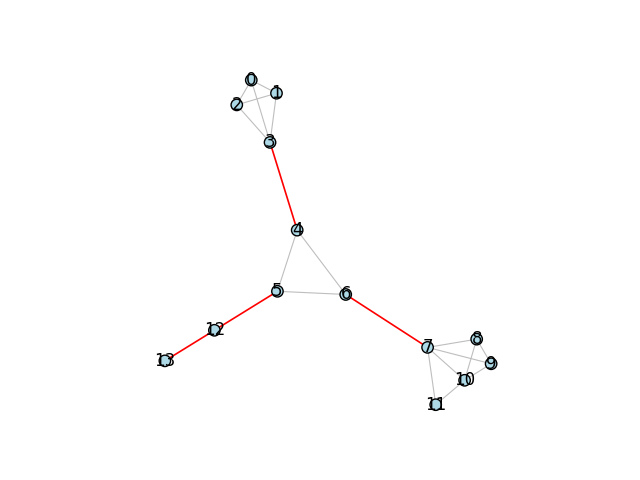
Then we can use a function to actually find the bridges, i.e. the edges that connect different parts of the graph:
bridges = g.bridges()
We set a separate color for those edges, to emphasize then in a plot:
g.es["color"] = "gray"
g.es[bridges]["color"] = "red"
g.es["width"] = 0.8
g.es[bridges]["width"] = 1.2
Finally, we plot the graph using that emphasis:
fig, ax = plt.subplots()
ig.plot(
    g,
    target=ax,
    vertex_size=0.3,
    vertex_color="lightblue",
    vertex_label=range(g.vcount())
)
plt.show()
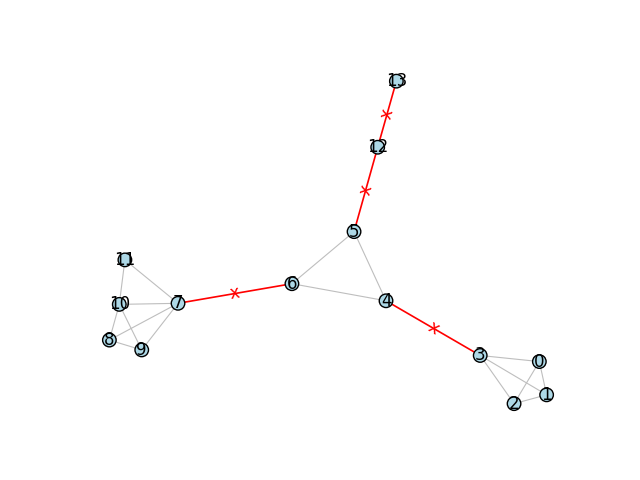
Advanced: Cutting Effect
Bridges are edges that when removed, will separate the graph into more components then they started with. To emphasise the removal of edges from the graph, we can add small “x” effect to each of the bridges by using edge labels.
As before, we begin by constructing the graph:
g = ig.Graph(14, [(0, 1), (1, 2), (2, 3), (0, 3), (0, 2), (1, 3), (3, 4),
        (4, 5), (5, 6), (6, 4), (6, 7), (7, 8), (7, 9), (9, 10), (10 ,11),
        (11 ,7), (7, 10), (8, 9), (8, 10), (5, 12), (12, 13)])
We then find and set the color for the bridges, but this time we also set a label for those edges:
bridges = g.bridges()
g.es["color"] = "gray"
g.es[bridges]["color"] = "red"
g.es["width"] = 0.8
g.es[bridges]["width"] = 1.2
g.es["label"] = ""
g.es[bridges]["label"] = "x"
Finally, we can plot the graph:
fig, ax = plt.subplots()
ig.plot(
    g,
    target=ax,
    vertex_size=0.3,
    vertex_color="lightblue",
    vertex_label=range(g.vcount()),
    edge_background="#FFF0",    # transparent background color
    edge_align_label=True,      # make sure labels are aligned with the edge
    edge_label=g.es["label"],
    edge_label_color="red"
)
plt.show()
Total running time of the script: ( 0 minutes 0.221 seconds)