Note
Click here to download the full example code
Erdős-Rényi Graph
This example demonstrates how to generate Erdős–Rényi graphs using igraph.GraphBase.Erdos_Renyi(). There are two variants of graphs:
Erdos_Renyi(n, p)will generate a graph from the so-called \(G(n,p)\) model where each edge between any two pair of nodes has an independent probabilitypof existing.Erdos_Renyi(n, m)will pick a graph uniformly at random out of all graphs withnnodes andmedges. This is referred to as the \(G(n,m)\) model.
We generate two graphs of each, so we can confirm that our graph generator is truly random.
import igraph as ig
import matplotlib.pyplot as plt
import random
First, we set a random seed for reproducibility
random.seed(0)
Then, we generate two \(G(n,p)\) Erdős–Rényi graphs with identical parameters:
g1 = ig.Graph.Erdos_Renyi(n=15, p=0.2, directed=False, loops=False)
g2 = ig.Graph.Erdos_Renyi(n=15, p=0.2, directed=False, loops=False)
For comparison, we also generate two \(G(n,m)\) Erdős–Rényi graphs with a fixed number of edges:
g3 = ig.Graph.Erdos_Renyi(n=20, m=35, directed=False, loops=False)
g4 = ig.Graph.Erdos_Renyi(n=20, m=35, directed=False, loops=False)
We can print out summaries of each graph to verify their randomness
ig.summary(g1)
ig.summary(g2)
ig.summary(g3)
ig.summary(g4)

# IGRAPH U--- 15 18 --
# IGRAPH U--- 15 21 --
# IGRAPH U--- 20 35 --
# IGRAPH U--- 20 35 --
IGRAPH U--- 15 23 --
IGRAPH U--- 15 28 --
IGRAPH U--- 20 35 --
IGRAPH U--- 20 35 --
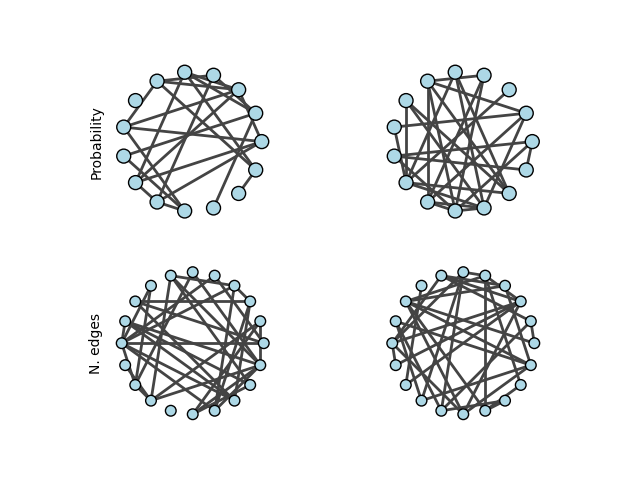
Finally, we can plot the graphs to illustrate their structures and differences:
fig, axs = plt.subplots(2, 2)
# Probability
ig.plot(
    g1,
    target=axs[0, 0],
    layout="circle",
    vertex_color="lightblue"
)
ig.plot(
    g2,
    target=axs[0, 1],
    layout="circle",
    vertex_color="lightblue"
)
axs[0, 0].set_ylabel('Probability')
# N edges
ig.plot(
    g3,
    target=axs[1, 0],
    layout="circle",
    vertex_color="lightblue",
    vertex_size=0.15
)
ig.plot(
    g4,
    target=axs[1, 1],
    layout="circle",
    vertex_color="lightblue",
    vertex_size=0.15
)
axs[1, 0].set_ylabel('N. edges')
plt.show()
Total running time of the script: ( 0 minutes 0.390 seconds)