Note
Click here to download the full example code
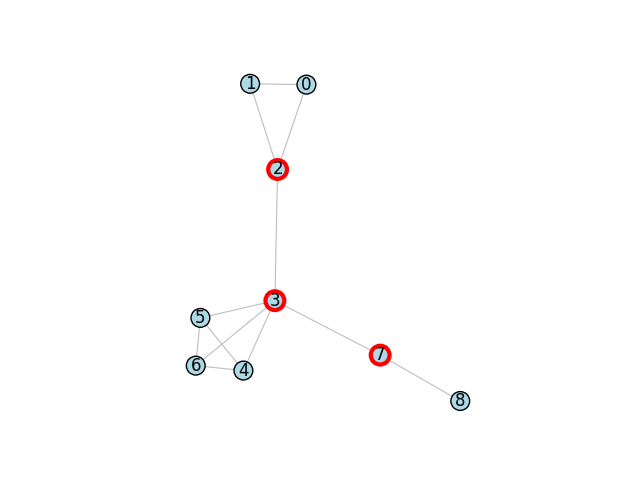
Articulation Points
This example shows how to compute and visualize the articulation points in a graph using igraph.GraphBase.articulation_points(). For an example on bridges instead, see Bridges.
import igraph as ig
import matplotlib.pyplot as plt
First, we construct a graph. This example shows usage of graph formulae:
g = ig.Graph.Formula(
    "0-1-2-0, 3:4:5:6 - 3:4:5:6, 2-3-7-8",
)
Now we are aready to find the articulation points as a vertex sequence
articulation_points = g.vs[g.articulation_points()]
Finally, we can plot the graph
fig, ax = plt.subplots()
ig.plot(
    g,
    target=ax,
    vertex_size=0.3,
    vertex_color="lightblue",
    vertex_label=range(g.vcount()),
    vertex_frame_color = ["red" if v in articulation_points else "black" for v in g.vs],
    vertex_frame_width = [3 if v in articulation_points else 1 for v in g.vs],
    edge_width=0.8,
    edge_color='gray'
)
plt.show()
Total running time of the script: ( 0 minutes 0.092 seconds)