Note
Click here to download the full example code
Delaunay Triangulation
This example demonstrates how to calculate the Delaunay triangulation of an input graph. We start by generating a set of points on a 2D grid using random numpy arrays and a graph with those vertex coordinates and no edges.
import numpy as np
from scipy.spatial import Delaunay
import igraph as ig
import matplotlib.pyplot as plt
We start by generating a random graph in the 2D unit cube, fixing the random seed to ensure reproducibility.
np.random.seed(0)
x, y = np.random.rand(2, 30)
g = ig.Graph(30)
g.vs['x'] = x
g.vs['y'] = y
Because we already set the x and y vertex attributes, we can use
igraph.Graph.layout_auto() to wrap them into a igraph.Layout
object.
layout = g.layout_auto()
Now we can calculate the delaunay triangulation using scipy’s scipy.spatial.Delaunay class:
Given the triangulation, we can add the edges into the original graph:
Because adjacent triangles share an edge/side, the graph now contains some edges more than once. It’s useful to simplify the graph to get rid of those multiedges, keeping each side only once:
g.simplify()
<igraph.Graph object at 0x7fecda5f7940>
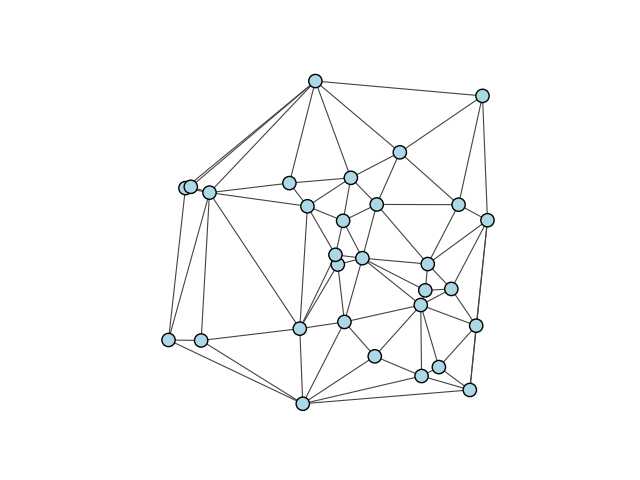
Finally, plotting the graph gives a good idea of what the triangulation looks like:
fig, ax = plt.subplots()
ig.plot(
    g,
    layout=layout,
    target=ax,
    vertex_size=0.04,
    vertex_color="lightblue",
    edge_width=0.8
)
plt.show()
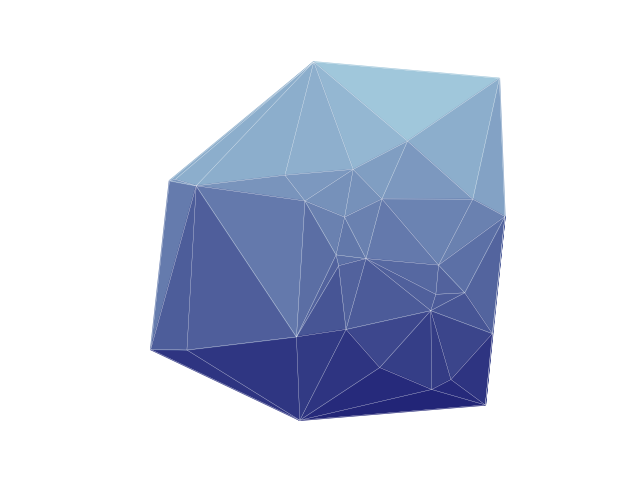
Alternative plotting style
We can use matplotlib to plot the faces of the triangles instead of the edges. First, we create a hue gradient for the triangle faces:
palette = ig.GradientPalette("midnightblue", "lightblue", 100)
Then we can “plot” the triangles using
matplotlib.patches.Polygon and the graph using
igraph.plot():
fig, ax = plt.subplots()
for tri in delaunay.simplices:
    # get the points of the triangle
    tri_points = [delaunay.points[tri[i]] for i in range(3)]

    # calculate the vertical center of the triangle
    center = (tri_points[0][1] + tri_points[1][1] + tri_points[2][1]) / 3

    # draw triangle onto axes
    poly = plt.Polygon(tri_points, color=palette.get(int(center * 100)))
    ax.add_patch(poly)

ig.plot(
    g,
    layout=layout,
    target=ax,
    vertex_size=0.0,
    edge_width=0.2,
    edge_color="white",
)
ax.set(xlim=(0, 1), ylim=(0, 1))
plt.show()
Total running time of the script: ( 0 minutes 0.497 seconds)