Note
Go to the end to download the full example code.
Shortest Paths
This example demonstrates how to find the shortest distance between two vertices of a weighted or an unweighted graph.
import igraph as ig
import matplotlib.pyplot as plt
To find the shortest path or distance between two nodes, we can use igraph.GraphBase.get_shortest_paths(). If we’re only interested in counting the unweighted distance, then we can do the following:
We can print the result of the computation:
if len(results[0]) > 0:
    # The distance is the number of vertices in the shortest path minus one.
    print("Shortest distance is: ", len(results[0]) - 1)
else:
    print("End node could not be reached!")
Shortest distance is: 3
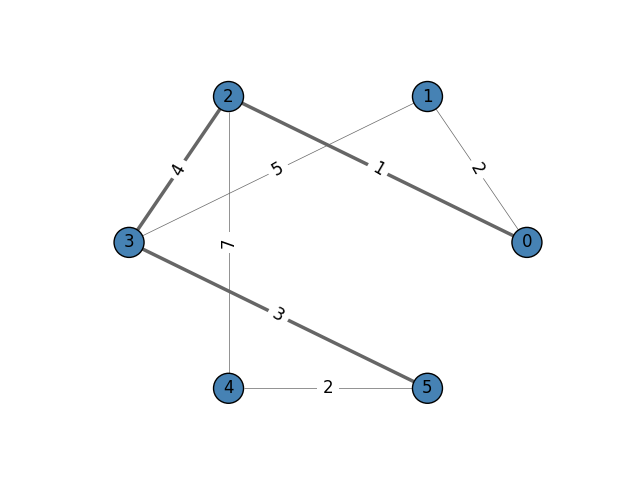
If the edges have weights, things are a little different. First, let’s add weights to our graph edges:
g.es["weight"] = [2, 1, 5, 4, 7, 3, 2]
To get the shortest paths on a weighted graph, we pass the weights as an
argument. For a change, we choose the output format as "epath" to
receive the path as an edge list, which can be used to calculate the length
of the path.
results = g.get_shortest_paths(0, to=5, weights=g.es["weight"], output="epath")

# results = [[1, 3, 5]]

if len(results[0]) > 0:
    # Add up the weights across all edges on the shortest path
    distance = 0
    for e in results[0]:
        distance += g.es[e]["weight"]
    print("Shortest weighted distance is: ", distance)
else:
    print("End node could not be reached!")
Shortest weighted distance is: 8
Note
igraph.GraphBase.get_shortest_paths()returns a list of lists becuase the to argument can also accept a list of vertex IDs. In that case, the shortest path to all each vertex is found and stored in the results array.If you’re interested in finding all shortest paths, take a look at
igraph.GraphBase.get_all_shortest_paths().
In case you are wondering how the visualization figure was done, here’s the code:
g.es["width"] = 0.5
g.es[results[0]]["width"] = 2.5

fig, ax = plt.subplots()
ig.plot(
    g,
    target=ax,
    layout="circle",
    vertex_color="steelblue",
    vertex_label=range(g.vcount()),
    edge_width=g.es["width"],
    edge_label=g.es["weight"],
    edge_color="#666",
    edge_align_label=True,
    edge_background="white",
)
plt.show()
Total running time of the script: (0 minutes 0.066 seconds)