Note
Go to the end to download the full example code.
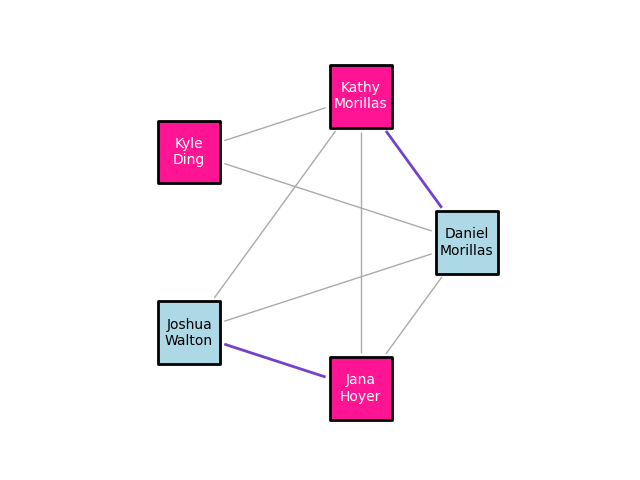
Visualising graphs with iplotx
iplotx (https://iplotx.readthedocs.io) is a library for visualisation of graphs/networks
with direct compatibility with both igraph and NetworkX. It uses matplotlib behind the
scenes so the results are compatible with the current igraph matplotlib backend and many
additional chart types (e.g. bar charts, annotations).
Compared to the standard visualisations shipped with igraph, iplotx offers:
More styling options
More consistent behaviour across DPI resolutions and backends
More consistent matplotlib artists for plot editing and animation
[<iplotx.network.NetworkArtist object at 0x715d66ad6650>]
import igraph as ig
import iplotx as ipx

# Construct a graph with 5 vertices
n_vertices = 5
edges = [(0, 1), (0, 2), (0, 3), (0, 4), (1, 2), (1, 3), (1, 4), (3, 4)]
g = ig.Graph(n_vertices, edges)

# Set attributes for the graph, nodes, and edges
g["title"] = "Small Social Network"
g.vs["name"] = [
    "Daniel Morillas",
    "Kathy Archer",
    "Kyle Ding",
    "Joshua Walton",
    "Jana Hoyer",
]
g.vs["gender"] = ["M", "F", "F", "M", "F"]
g.es["married"] = [False, False, False, False, False, False, False, True]

# Set individual attributes
g.vs[1]["name"] = "Kathy Morillas"
g.es[0]["married"] = True

# Plot using iplotx
ipx.network(
    g,
    layout="circle",  # print nodes in a circular layout
    vertex_marker="s",
    vertex_size=45,
    vertex_linewidth=2,
    vertex_facecolor=[
        "lightblue" if gender == "M" else "deeppink" for gender in g.vs["gender"]
    ],
    vertex_label_color=[
        "black" if gender == "M" else "white" for gender in g.vs["gender"]
    ],
    vertex_edgecolor="black",
    vertex_labels=[name.replace(" ", "\n") for name in g.vs["name"]],
    edge_linewidth=[2 if married else 1 for married in g.es["married"]],
    edge_color=["#7142cf" if married else "#AAA" for married in g.es["married"]],
    edge_padding=3,
    aspect=1.0,
)
Total running time of the script: (0 minutes 0.181 seconds)